
Tharani mittakolu
Senior Data Analyst (Gen AI) @ Goldman Sachs
United States
New Jersey
Information Technology & Services
-
Experience

Senior Data Analyst (Gen AI)
Goldman Sachs

Richardson, TX
Architected GenAI-powered analytics solutions including Text-to-SQL assistants using Python and OpenAI APIs, enabling non-technical users to query live banking data via chat. Implemented Retrieval-Augmented Generation (RAG) pipelines to index thousands of internal compliance documents, cutting regulatory research time by 60%. Applied Prompt Engineering to normalize unstructured transaction descriptions for fraud and risk analysis. Built LLM-driven analytics apps using Streamlit to summarize earnings calls, extract sentiment, and generate executive-ready narratives. Analyzed customer support chats using NLP (spaCy / Transformers) to detect emerging complaint patterns before escalation. Automated executive risk narrative reports using GenAI with controlled templates, review gates, and governance standards. Designed executive-level dashboards in Tableau and Power BI for liquidity risk, branch performance, and enterprise KPIs. Developed advanced LOD expressions, DAX measures (rolling windows, cohorts, weighted rates), and variance-to-plan analytics. Integrated GenAI-generated KPI explanations directly into dashboards to contextualize performance drivers. Optimized dashboard performance using Snowflake materialized views and extract tuning strategies. Implemented Row-Level Security (RLS) across BI platforms to enforce least-privilege access by region, branch, and portfolio.

Data Analyst (GenAI)
Apple
Sunnyvale, CA
Leveraged Generative AI (LLMs, embeddings) to auto-categorize large volumes of customer reviews into sentiment themes (Quality, Shipping, Price) to surface actionable product insights. Built vector-based similarity and recommendation prototypes using Python, FAISS/pgvector, enabling “Similar Products” discovery for e-commerce shoppers. Analyzed search query logs to identify zero-result keywords, directly influencing merchandising and inventory gap resolution. Implemented real-time anomaly detection on order volumes using Python (pandas, scikit-learn) to flag site issues and demand spikes. Supported marketing personalization by generating AI-assisted email subject lines using LLMs and customer purchase history. Developed a GenAI “Insight Assistant” to draft weekly business narratives with anomaly callouts and recommended actions, governed by prompt templates and metric grounding. Designed enterprise-grade dashboards in Power BI to monitor inventory, supply chain KPIs, and multi-channel commerce performance across 50+ distribution centers. Built advanced DAX measures for sell-through, weeks of supply, funnel conversion, ROAS, retention, and cohort-based trends. Delivered interactive drill-through, bookmarks, alerts, and guided analysis flows to accelerate executive decision-making. Developed Tableau dashboards for merchandising and category performance using LOD expressions, parameters, actions, and extract optimization. Implemented Row-Level Security (RLS) across Power BI/Tableau to enforce regional, partner, and least-privilege access. Queried and optimized large datasets in AWS Redshift and Amazon Athena (S3) to analyze peak retail events and clickstream behavior. Tuned complex SQL using execution plans, partitioning, clustering, and cost-aware design to reduce refresh time and warehouse spend.Built curated views, stored procedures, and semantic models to support executive and self-service reporting.

Data Analyst
Molina Healthcare
Bothell, WA
Analyzed medical claims and eligibility data to identify cost drivers, PMPM trends, utilization patterns, and revenue forecasts by plan year. Detected payment leakage and potential fraud by correlating duplicate claims and provider billing outliers using SQL, identifying $1.5M+ in overpayments. Evaluated readmission rates, denials, and turnaround times to support CMS Star Ratings, HEDIS performance, and operational improvements. Delivered end-to-end analytics across claims, authorizations, enrollment, and service center KPIs with actionable root-cause insights. Built Population Health and provider performance dashboards in Tableau with drill-through by plan, site, location, and service category. Designed executive scorecards and operational reviews using Tableau Stories, parameters, actions, and certified data sources on Tableau Server. Developed Power BI dashboards with advanced DAX for SLA compliance, backlog aging, denial/appeal trends, and call center metrics. Produced paginated/compliance reports using SSRS for controlled distribution and regulatory submission. Wrote and optimized complex SQL (views, procedures, execution plans) to flatten hierarchical JSON from HIE feeds and reduce query latency. Designed reporting data models (fact/dimension) with clear grain, conformed dimensions, and reconciliation-ready aggregates. Partnered with DBAs on indexing, partitioning, and performance tuning for large-scale claims and eligibility tables. Ensured HIPAA compliance and secure handling of PHI through approved access patterns and controlled exports. Validated data quality for HEDIS submissions using automated counts, totals, exceptions, and cross-system reconciliation checks. Managed ICD-10 and CPT reference tables; maintained data lineage, KPI dictionaries, and audit-ready documentation.

Data Analyst
DataFactZ
India
Developed and maintained operational and financial reports using SQL Server, SSRS, Power BI, and Tableau for leadership and business teams. Wrote optimized SQL queries, views, stored procedures, and functions to standardize transformations and reduce query runtimes from minutes to seconds. Built automated reporting pipelines using SQL Server Agent jobs and scheduled refreshes to ensure timely data delivery. Created interactive Power BI datasets and dashboards with DAX (trends, rolling metrics, variance analysis) and Tableau dashboards with drilldowns by region, product, and customer. Delivered recurring KPI packs and fixed-format reports (SSRS) with automated distribution and controlled access. Automated manual reporting using Excel VBA Macros, saving ~10 hours per week and improving consistency. Built reusable Excel analysis templates using Pivot Tables, Power Pivot, VLOOKUP, and INDEX-MATCH for ad-hoc analysis and rapid validation. Connected Excel directly to SQL Server for live data refreshes and near-real-time reporting. Standardized input templates and reporting formats to improve data quality and usability across teams. Analyzed sales, revenue, utilization (bench vs. billable), profitability, attrition, and SLA performance to support operational and hiring decisions. Forecasted quarterly revenue using sales pipeline probabilities and historical performance trends. Conducted root-cause analysis on KPI movements and delivered clear, stakeholder-ready insights with recommended actions. Implemented data quality frameworks (counts, totals, duplicates, missingness) to ensure accuracy of critical reports. Created reconciliation sheets aligning BI outputs with source systems and finance totals during closes and audits.

Junior Data Analyst
Evoke Technologies
India
Supported weekly and monthly KPI reporting and executive scorecards using SQL, Excel, Power BI, and Tableau. Gathered reporting requirements and clarified KPI definitions with business stakeholders to ensure metric consistency. Extracted and prepared datasets using SQL joins, filters, and GROUP BY, validating outputs against known control totals. Built basic SQL views to standardize repeated extracts and reduce manual reporting effort. Assisted in developing early Power BI and Tableau dashboards, improving visual clarity, labeling, and usability. Cleaned and prepared datasets using Excel (Pivot Tables, modern functions, text-to-columns, duplicate removal). Created repeatable Excel reporting templates and simple charts (bar, pie) for operational teams. Maintained formatting and presentation standards across Excel reports and PowerPoint decks for leadership reviews. Performed basic data profiling checks (missing values, duplicates) and escalated anomalies to data owners. Built reconciliation sheets comparing multiple sources and documented discrepancies and resolutions. Implemented validation checklists and manual cross-checks to reduce errors in recurring reporting cycles. Verified data accuracy against source documents during reporting and digitization efforts. Supported UAT by validating report outputs, capturing feedback, logging defects, and verifying fixes. Assisted with production reporting issues by collecting evidence, confirming data availability, and supporting troubleshooting. Maintained report inventories, refresh calendars, and archives to ensure on-time and reliable delivery. Coordinated with IT/DB teams to confirm refresh timing, data readiness, and access availability. Documented report logic, assumptions, filters, data sources, and KPI definitions for knowledge sharing.
Education

Jain (Deemed-to-be University)
Computer Science
Tharani mittakolu's Contact Information
Phone
Find the Right Leads
Find Verified Contact Data

What LeadContact does well
Find verified emails, phone numbers, and decision-makers with 98% accuracy.

Find Leads
Find the right people by company, role, industry, location, and more.
925M+ professional profiles


Find Emails
Access verified email addresses for your target contacts.
657M+ emails


Find Phone Numbers
Get cross-validated phone data from multiple top sources.
239M+ phone numbers

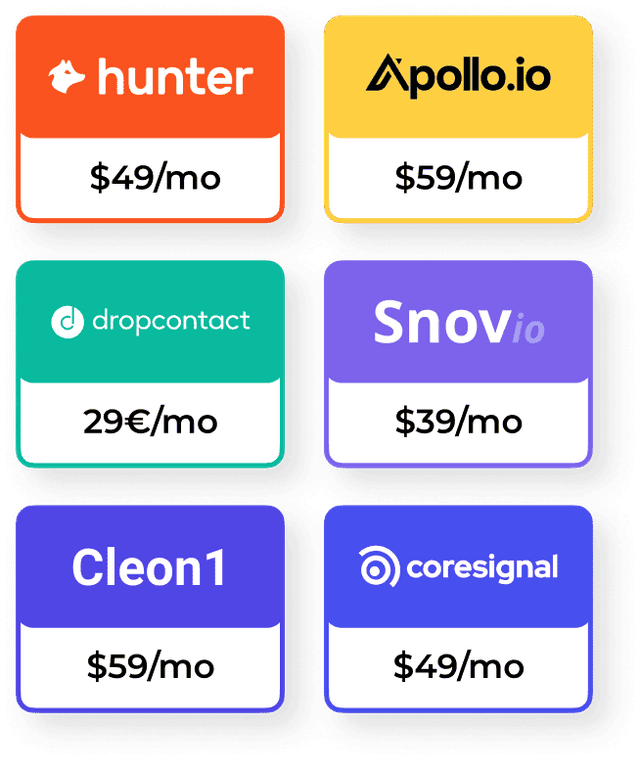
More Accurate. Lower Cost.
Find contact data in 1 tool with 98% accuracy
LeadContact integrates leading enrichment tools to deliver more accurate contact data—without paying for each one.

Great conversations start with the right contact.
It’s time to find yours.