
Payal Gore
Data Research Analyst @ Indiana University School of Public Health-Bloomington
About
I ask WHY before I write SQL. Most analysts dive straight into the query. I pause first. What decision hangs on this data? That question has shaped everything I've built. I sketch dashboards on paper before opening Tableau. I build three-layer data models when everyone says just pull from production. Not because I'm slow because fast answers are worthless when they're wrong. That instinct took me from a BTech in IT in Mumbai to a Data Science MS at Indiana University, and eventually to New York where I rebuilt the financial reporting infrastructure a healthcare company's Finance team used to close their books. Four disconnected systems, no source of truth. I mapped every definition, built every validation layer. Month-end close got 30% faster. Finance stopped asking is this number right? and started asking what should we do about it? That shift -> from questioning data to acting on it -> is what I build for. Along the way I've wrangled 3M+ transactions into customer segments, turned enrollment chaos into marketing strategy, and helped Product Managers understand why 35% of students had zero peer interactions. Different domains. Same muscle. Lately that muscle has expanded into AI. I built a sales intelligence agent that answers pipeline questions in plain English in 11 seconds instead of 5 hours with a validation layer that cross-checks every number before it reaches anyone. One wrong number in a VP report doesn't just damage the output. It destroys trust in the entire system. I think in business problems first, technology second. The SQL is just the tool. The decision is what matters. Currently exploring full-time roles at the intersection of data, financial operations, and AI.
United States
New York
Information Technology & Services
Tableau, Amazon Redshift, Financial Reporting, Data Analysis, Data Preprocessing & Cleaning, Predictive Analytics, Python (Pandas, NumPy), Excel (Pivot Tables, VLOOKUP, Data Validation), Exploratory Data Analysis (EDA), Power BI (Dashboards & Data Visualization), Business & Product Analytics, SQL & Database Management , Workflow Optimization & Process Improvement , Business Intelligence & Data-Driven Decision Making, Python (Programming Language), SQL, Machine Learning (SciKit-learn), Google Cloud Platform (GCP), Extract, Transform, Load (ETL), Workflow Automation
Experience

Data Research Analyst
Indiana University School of Public Health-Bloomington

United States
As part of a cross-functional research team, I work on data-driven public health initiatives that combine statistical rigor with real-world impact. Nutritional Study: Protein vs. Carb Bars We aimed to evaluate how different snack types affect post-meal behavior. I cleaned and analyzed data from 250+ participants using Python (Pandas, NumPy) and Excel. Through exploratory analysis and A/B testing, I discovered that high-protein bars reduced post-meal calorie intake by 20%. These insights directly shaped the product formulation strategy, favoring whey protein and low-sugar variants based on participant preferences. Skills Used: Python · Excel · A/B Testing · EDA · Statistical Analysis Student Engagement Analytics: CRM + Web Tracking In a parallel project, I led the development of a cloud-based pipeline on GCP to understand how students interact with wellness initiatives. I integrated CRM and Google Analytics data for 1,200+ students using BigQuery, DataFlow, and Cloud Functions. Segmenting users into engagement profiles allowed us to identify outreach gaps. I visualized these insights in Looker Studio dashboards, which helped stakeholders redesign campaigns—resulting in a 25% increase in program participation. Skills Used: GCP (BigQuery, DataFlow, Cloud Functions) · Looker Studio · SQL · Data Integration · Segmentation · Behavioral Analytics These projects have deepened my interest in behavioral analytics and product-driven data science, especially where public health and technology intersect.

Tableau Reporting Specialist
DocGo
New York, NY
As part of the BI & Finance team, I contribute to automating revenue analytics and AR reconciliation processes, ensuring financial accuracy and compliance. Revenue & AR Analytics I design SQL/dbt pipelines and Tableau dashboards that track AR aging and revenue flash metrics. These reporting views streamline manual workflows and accelerate month-end close cycles. Financial Compliance & Reporting I support ASC 606 revenue recognition by reconciling outputs from billing data with legacy finance systems, improving reporting accuracy and audit readiness. Skills Used: SQL · dbt · Tableau · Redshift · Data Integration · Financial Analytics · AR Reporting

Research Assistant
Indiana University Bloomington
As a Research Analyst, I contributed to two major initiatives: improving student engagement through behavioral analytics, and supporting online program growth through enrollment insights and market research. Student Behavior Analytics I analyzed usage logs from 1,000+ students to uncover how they engaged with academic collaboration tools. Using SQL and Tableau, I tracked login times, edit frequency, and peer interactions—finding that 35% of highly active users weren’t collaborating with others. To deepen our understanding, I applied time series analysis to uncover peak usage windows and session durations, which helped academic support teams better target outreach. I also collaborated with product managers to define research objectives and shared insights with leadership through visual, presentation-ready reporting. Online Program Growth In a parallel effort, I worked closely with the Director of Online Programs to strengthen Luddy’s digital outreach strategy. I analyzed enrollment trends using R and Excel, uncovering key applicant segments across global vs. domestic pools. I also created Tableau dashboards and delivered competitive landscape analyses, helping leadership differentiate Luddy’s online degrees in a growing higher-ed market. Skills Used: SQL · Tableau · R · Excel · Time Series Analysis · KPI Dashboards · Market Research · Cross-functional Collaboration

Founder & Operator
Produce Retail & Wholesale Venture
Mumbai
Founded and operated a produce retail and wholesale business managing procurement, pricing strategy, and profitability optimization across 15+ perishable product categories. Key Achievements: - Built demand forecasting and pricing frameworks from scratch using Excel, reducing weekly spoilage by 20% and improving profit margins through data-driven procurement and pricing decisions - Analyzed daily sales patterns, supplier costs, seasonal demand shifts, and competitive pricing to dynamically adjust pricing strategy across product categories - Developed supplier cost tracking system that enabled volume-based negotiations, reducing procurement costs while maintaining quality standards - Managed high-velocity, perishable inventory operations requiring real-time pricing adjustments to balance competitive positioning with margin protection - Functioned as a one-person pricing and FP&A operation, applying analytical rigor to optimize revenue, margins, and working capital efficiency Skills: Pricing Strategy · Financial Analysis · Demand Forecasting · Margin Analysis · Excel · Data Analysis · Vendor Management · Profitability Optimization

Social Media Manager
Bug Busters
Mumbai
A community by the students, for the students and of the students where aim was to equip students with technical skills by arranging various workshops, webinar etc.

Data Science Intern
Vidyalankar Institute of Technology, Mumbai
Wadala
Project: Mental Health Impact Study During the Pandemic Objective: Understand how the pandemic affected student well-being across different colleges using real-world data. What I Did: Led end-to-end analysis of Qualtrics survey data from 1,000+ students to study the impact of the pandemic on mental and physical health. Cleaned and preprocessed the dataset (handled missing values, encoded categorical variables) and applied both linear and logistic regression using Scikit-learn to uncover the top 5 stress predictors. Found that academic pressure affected 80% of students—emerging as the dominant stressor. What I Built: Developed interactive Power BI dashboards featuring: • Geospatial heatmaps to compare anxiety levels across regions • Campus-type slicers (urban vs. rural) • Clustered bar charts to visualize key demographic stress indicators Insights revealed 40% higher anxiety in urban campuses, enabling targeted wellness strategies across 3 focus regions. Skills Used: SQL · Python · Scikit-learn · Power BI · Regression Analysis · Data Cleaning · Data Visualization · Geospatial Analytics

Co Creative Head
Information Technology Student's Association
Creative Core
ISTE VIT
Education

Indiana University Bloomington
Data Science
Course Work: Introduction to Statistics Data mining Applied Algorithms

Vidyalankar Institute of Technology, Mumbai
Information Technology
Payal Gore's Contact Information
Phone
Find the Right Leads
Find Verified Contact Data

What LeadContact does well
Find verified emails, phone numbers, and decision-makers with 98% accuracy.

Find Leads
Find the right people by company, role, industry, location, and more.
925M+ professional profiles


Find Emails
Access verified email addresses for your target contacts.
657M+ emails


Find Phone Numbers
Get cross-validated phone data from multiple top sources.
239M+ phone numbers

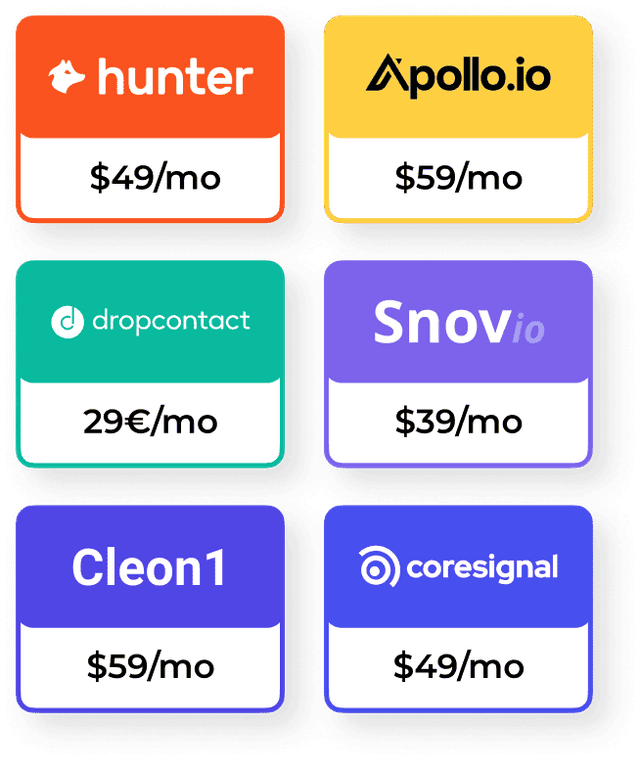
More Accurate. Lower Cost.
Find contact data in 1 tool with 98% accuracy
LeadContact integrates leading enrichment tools to deliver more accurate contact data—without paying for each one.

Great conversations start with the right contact.
It’s time to find yours.