
Eric Koo
Director, Data Science @ Niantic, Inc.
About
I'm interested in using data to inform decisions and derive insights and strive to put information to good use through visualizations and solid interface design. Mostly I just enjoy working on and building things that people will find useful. I have lots of experience dealing with large amounts of data and also have strong front-end web development skills.
United States
San Francisco
Internet
Python, User Interface Design, HTML, Web Design, Web Development, Data Analysis, R, JavaScript, CSS, SQL, Analytics, Statistics, Amazon Redshift, Microsoft Office, ETL, BI, Forecasting, Recommender Systems, Microsoft Excel, MySQL
Experience

Director, Data Science
Niantic, Inc.

San Francisco Bay Area

Manager, Growth Analytics
Grove Collaborative
San Francisco Bay Area
• Improved daily demand forecast accuracy from an R-squared of .3 to .77. • Measured effectiveness of marketing channels (e.g. Facebook, Google Adwords, Pinterest, direct mail, podcast, etc.) by comparing first- and last-touch attribution, doing matchback analysis, and incorporating How Did You Hear About Us responses. • Built data pipeline to transform raw web event data from Mixpanel into structured, sessionized tables including conversion rates, AB testing, revenue, and customer metadata, enabling detailed internal product analytics for the first time. • Greatly increased general usage and usability of our BI tool (Looker) by reorganizing and annotating fields in the UI, cutting query times in half, and creating high-quality visualizations and dashboards. In just a few short months, some of these became the most popular and favorited dashboards of all time with users constantly monitoring in real-time. • Reduced Redshift query execution times by 50-100% by refactoring tables into star schema of consolidated fact and dimension tables that prioritized business needs.

Data Scientist
Educents Marketplace (Acquired)
San Francisco Bay Area
• Built novel recommendation engine that nearly doubled clickthrough rate and add to cart through product page carousels (87% increase in clickthrough, 97% increase in add to cart). • Created fully-automated email marketing system to send personalized content and product recommendations using over 100 different triggers based on users’ purchase and browsing history, resulting in a global 31% open rate and a 24% click-to-open rate. • Implemented marketing attribution models, allowing us to greatly increase efficiency of marketing spend by reducing channel overlap. Unified financial information, granting visibility for the first time into seller- and product-level sales, discounts, and profitability. • Created and maintained dashboards for marketing, operations, product, and executive teams. • Maintained derived tables in ETL process.

Senior Data Analyst
SpoonRocket
Berkeley, CA
• Reduced food waste by 25% by using historical data to inform inventory forecasts even as the number of daily menu offerings increased from 4 to over 12. • Created framework to monitor and prioritize issues relating to food quality. Optimized menu selection to maximize customer demand and sales. • Streamlined and automated supply chain and vendor communications. • Identified rampant referral fraud with 60% of referred users being duplicate accounts. • Built corporate order webpage that allowed businesses and office managers to view menus and schedule large orders in advance, resulting in 2.2% of additional revenue. • Responsible for translating high-level inquiries into reports, dashboards, and visualizations for executive team (e.g. inventory tracking, algorithm performance, driver monitoring, customer retention, P&L, contribution margin, etc).

Co-Founder / Front End Developer
ResMaps
Ann Arbor, MI
ResMaps is a site that allows users to create a sleek-looking web resume and provides them with the ability to view detailed analytics and heatmaps showing not only who looked at their resume, but also what they looked at.

Data Analyst
University of Michigan
Ann Arbor, MI
• First to start analyzing data for all of UM’s courses offered through Coursera (e.g. scores, engagement, lecture views, assignment submissions, survey responses, etc.). • Used Python scripts to parse and manipulate raw unstructured data to usable format; used R and ggplot2 to generate reports and data visualizations. Presented initial exploratory data analysis findings at the Student Learning and Analytics at Michigan (SLAM) seminar.
Programmer/Analyst
Insight Learning Technology
Los Angeles, CA
• Used multidimensional scaling to visualize differences and perceived difficulty of stimuli in experimental learning modules. • Spearheaded effort to convert old Flash-based learning modules into to web framework.
Education

University of Michigan - School of Information
Information Analysis and Retrieval (IAR) & Human Computer Interaction (HCI)

UCLA
Statistics & Cognitive Science
Eric Koo's Contact Information
Phone
Find the Right Leads
Find Verified Contact Data

What LeadContact does well
Find verified emails, phone numbers, and decision-makers with 98% accuracy.

Find Leads
Find the right people by company, role, industry, location, and more.
925M+ professional profiles


Find Emails
Access verified email addresses for your target contacts.
657M+ emails


Find Phone Numbers
Get cross-validated phone data from multiple top sources.
239M+ phone numbers

More Accurate. Lower Cost.
Find contact data in 1 tool with 98% accuracy
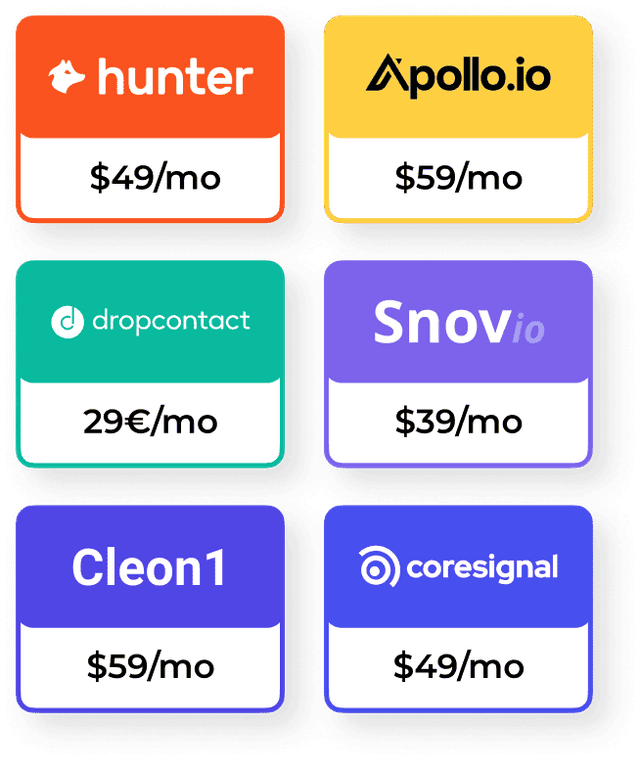
LeadContact integrates leading enrichment tools to deliver more accurate contact data—without paying for each one.


Great conversations start with the right contact.
It’s time to find yours.